|
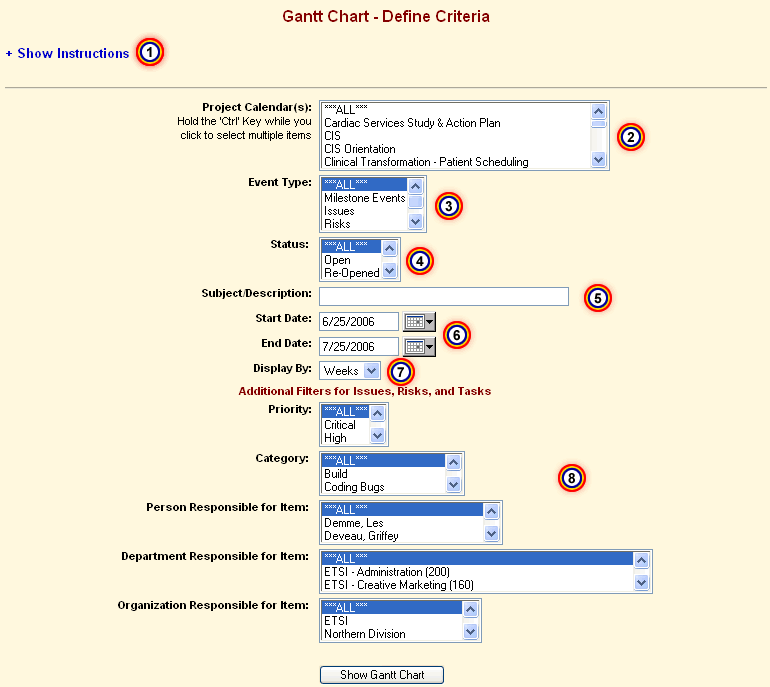
Instant "Help" Information. Eclipse Project provides quick, easy
access to a help section for the page.
|
|
|

|
Display information for multiple projects. Select one or any combination of
projects to view in your Gantt Chart.
|
|
|

|
Decide which Item Types to display. Unlike other systems on the market,
Eclipse Project allows you include multiple types of items in your Gantt Chart.
You have the ability to include
Milestone Events, Issues, and/or Risks. This allows you
to get a true picture of where your resources' time is going to be allocated.
|
|
|

|
Filter Items by their current Status.
|
|
|

|
Enter Keywords to narrow down the results.
|
|
|

|
Select the date range for your Gantt Chart.
|
|
|

|
You can display your Gantt Chart in days, weeks, or months.
|
|
|

|
Additional Filtering Options Available. Users have multiple options
to narrow down the results that are displayed in Gantt Charts. These options
allow users to display only the information they want to view.
|

